Getting alerts right can be hard. It’s not uncommon to see alerts which are too noisy, paging on-call engineers for small numbers of errors, where either the error rate was very low or the duration of the error-producing event was very short. This can cause alert fatigue, and result in real incidents being ignored. On the other hand, many alerts are not sensitive enough and errors can occur at high rates without detection.
In this post I’ll talk through how I approach writing alerts which find a better balance.
Definitions
Let’s begin with some definitions.
- Alert
-
A notification of a significant event. Probably results in an on-call engineer being paged. Alerts are configured by alerting rules.
- Event
-
Something which is causing increased error rates. An event might trigger an alert. A significant event is one we want to alert on. Not all events are significant.
- SLO
-
Service Level Objective, e.g. 99.9% successful requests over 30 days. The SLO rate is the percentage of successful requests (99.9%), and the SLO window is the duration (30 days). Atlassian have a good overview of SLIs vs SLOs vs SLAs.
- Error budget
-
The inverse of the SLO, i.e. 0.1% over 30 days in this case. A measure of how many errors we can have while still meeting our SLO.
- Burn rate
-
How quickly the error budget is getting used up. A constant 1% error rate would take 3 days to use up an entire 30 day error budget.
Simple example
Let’s assume we have an SLO of 99.9% availability (successful requests) over 30 days.
One of the simplest alerts we could write is something like this Prometheus alerting rule written in PromQL:
# Simplified for clarity
- alert: HighErrorRate
  expr: >
    (
      sum(rate(requests_total{error="true"}[5m]))
      /
      sum(rate(requests_total[5m]))
    )
    > 0.002
This alerts if we have an error rate higher than 0.2%, averaged over the last 5 minutes.
We could write this as:
- Error threshold: 0.2%
- Alert window: 5 minutes
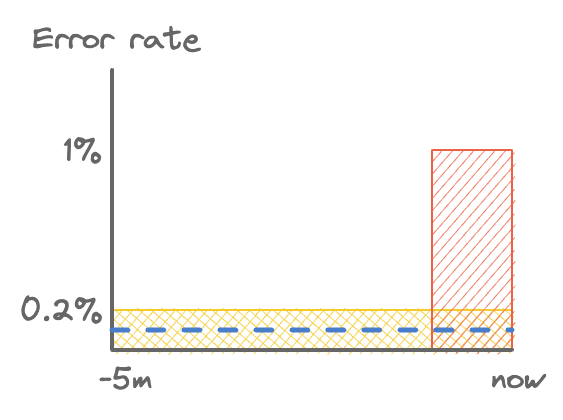
I’ll be using these diagrams a lot, so I’ll quickly introduce them. What you see below is the error rate over the last hour, with a short burst of errors in red. As time progresses, that burst moves to the left. If this is a 1% error rate for 2 minutes, then that’s a 0.4% average over 5 minutes. This will trigger the alert.
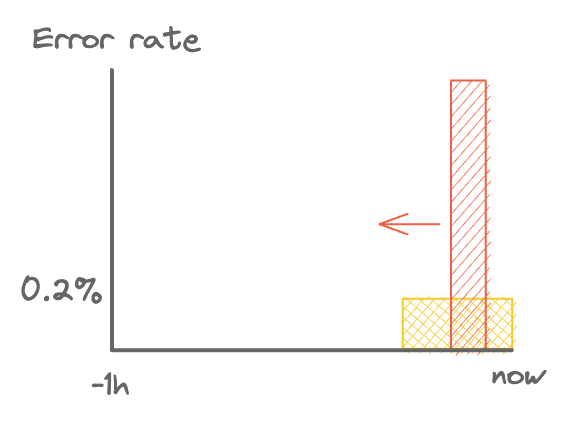
A short burst of errors.
A general intuition: if the area of the red box is larger than the yellow box (within the alert window), then an alert will fire.
Neither of the below will fire.
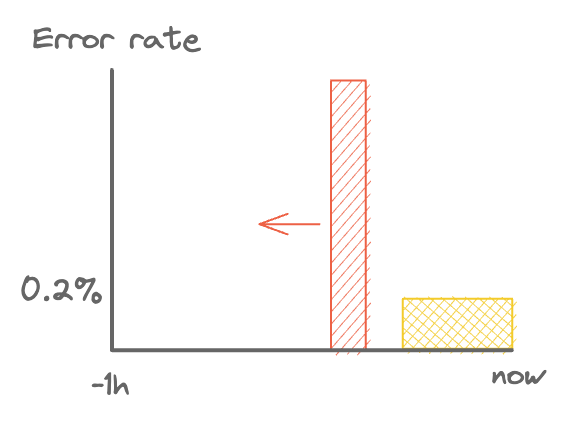
The errors happened too long ago for the alert to fire.
The average error rate is too low to trigger the alert.
So what’s the problem with this alerting rule? To start, there are cases when it should fire but doesn’t. That is, there are significant events that are missed. Below is an example case, where the blue dashed line represents the SLO rate. The error rate is a continuous 0.15%, which if continued undetected would eventually blow the error budget and cause us to fail our SLO.
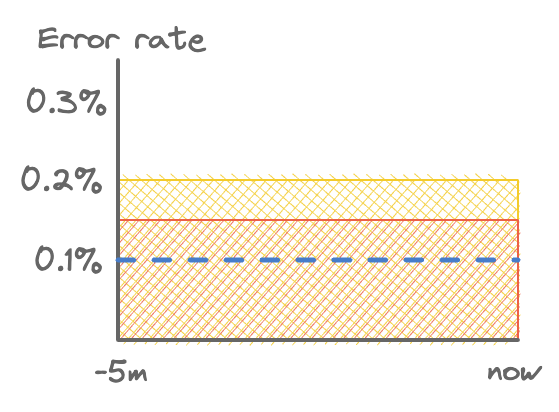
False negative: steady 0.15% error rate.
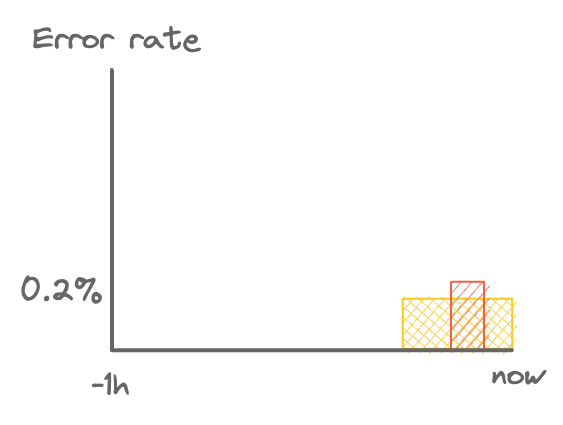
There’s another problem too. A one-off error spike of > 1% for 1 minute (> 0.2% average over 5 minutes) would trigger the alert. If it only lasts a minute, the issue would have resolved itself before an engineer was able to respond. We’ll define significance later, but for now let’s just say this is not a significant event. While it might be worth investigating, it’s probably not worth waking anyone up for.
False positive: 1% spike for 1 minute.
Measuring success
So this alerting rule has some problems. It’s worth defining what these are so we know how to improve. We’ll be using the following measures of success:
- Significance
-
What is the threshold above which we consider an event to be significant?
If it’s too low then our alerts might be too noisy without good cause. Too high, we might not meet our SLO.
- Precision
-
What proportion of detected events were significant? Higher is better.
Low precision means we alert too much on non-significant events.
- Sensitivity
-
What proportion of significant events were detected? Higher is better.
Low sensitivity means the significant events are not alerted on.
- Detection time
-
How long after a significant event starts does the alert fire? Shorter is better.
- Reset time
-
How long after the significant event ends does the alert continue firing? Shorter is better.
Measuring significance is something we’ll come back to later. For now, we’ll just use our intuition.
Considering the alerting rule above, we can say that it is not sensitive enough because it doesn’t alert on all significant events. We can also say it’s not precise enough because it alerts on non-significant events.
Reducing the error threshold to 0.1% would make the alert more sensitive, but less precise, and vice versa for increasing the error threshold.
Widening the alert window has the effect of making the rule more precise. This is because it takes longer for a given error rate to trigger the alert. In other words, the event needs to be more significant. Alerts won’t go off for short periods of low error rates.
Consider the 2 minute period of 1% error rate above. With a 5 minute window, that’s an average of 0.4%, which will trigger an alert. With a 1 hour window it averages out at 0.033%, which is below the threshold.
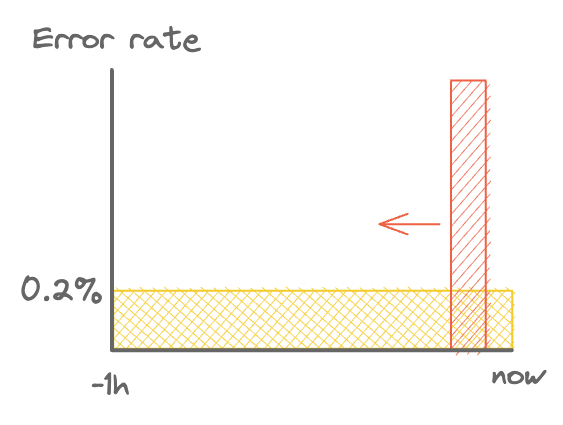
A wider alert window.
Detection times and reset times are also affected by the alert window: wider windows take longer both to detect a given error rate and to reset after the errors are resolved. Detection times are also naturally shorter for higher error rates, as shown in the table below for our example 0.2% error threshold.
| Error rate | Detection time (5m window) | Detection time (1h window) |
|---|---|---|
| 0.1% | ∞ | ∞ |
| 0.2% | 5m | 1h |
| 1% | 1m | 12m |
| 10% | 6s | 1.2m |
| 100% | 0.6s | 7.2s |
detection_time = error_threshold * alert_window / error_rate
To summarise:
- Wider window = higher precision, but longer detection and reset times.
- Lower error threshold = higher sensitivity, but lower precision.
This looks like a difficult problem to solve: every change we make improves one measure, but worsens others! Luckily, there are a few tricks we can use.
Improving sensitivity and precision
Let’s start by looking at sensitivity. Our SLO requires 99.9% successful requests, but we’re only alerting on a 0.2% error rate. This is trivially fixed by changing our error threshold to 0.1%. This gives us 100% sensitivity: every significant event will now trigger an alert.
However, this reduces precision! Alerts will now fire for shorter and lower error spikes which are not significant. Wider alert windows improve precision, so let’s try increasing this to 1 hour. We can look at how high an error spike would need to be to trigger an alert:
| Spike duration | Error rate to trigger alert |
|---|---|
| 1m | > 6% |
| 5m | > 1.2% |
| 1h | > 0.1% |
So we now have this alerting rule:
- Error threshold: 0.1%
- Alert window: 1 hour
This is arguably better: it has improved both sensitivity and precision, with a slightly longer detection time.
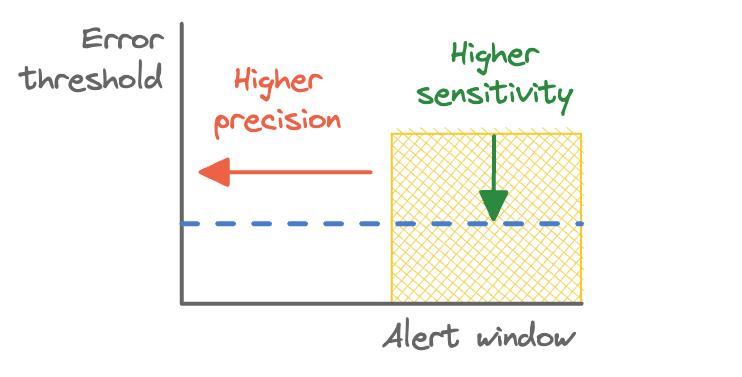
Adjusting the error threshold and alert window.
At this point we might ask ourselves:
- Is this precise enough? Can we do even better?
- Is our detection time too long? Or perhaps too short?
- Is it really worth waking someone up after an hour of a 0.1% error rate?
Our first step towards answering these questions is to look at burn rates.
Burn rates
As stated above, a burn rate is how fast we’re using up our error budget. Burn rates are really useful because they give us a good idea of how quickly we need to respond to a given event before our SLO is impacted. That is, it tells us what our detection time should be!
A burn rate of 1 will use up the exact error budget in the SLO window. For our example SLO it will take 30 days to use up the entire budget. A burn rate > 1 will use up the error budget in less time.
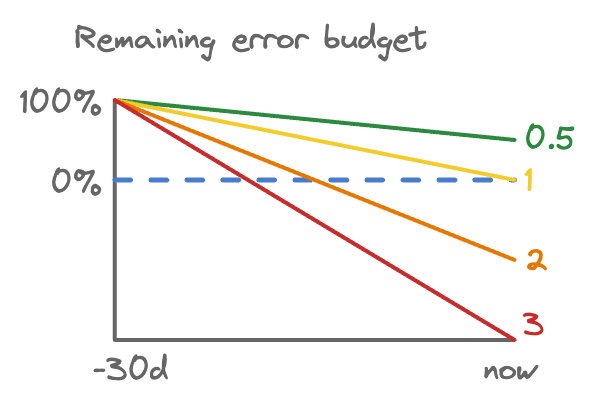
Burn rates using up an error budget.
Given an SLO and an error rate we can work out a burn rate, and how long it will take to exhaust the error budget:
burn_rate = error_rate / (1 - slo_rate)
time_to_exhaustion = slo_window / burn_rate
For our example SLO with a 0.2% error rate:
burn_rate = 0.002 / (1 - 0.999) = 2
time_to_exhaustion = 30 / 2 = 15 # days
Here’s a handy table with some examples:
| Error rate | Burn rate (99.9% SLO) | Time to exhaustion (30 day SLO) |
|---|---|---|
| 0.1% | 1 | 30 days |
| 0.2% | 2 | 15 days |
| 0.5% | 5 | 6 days |
| 0.6% | 6 | 5 days |
| 1% | 10 | 3 days |
| 1.44% | 14.4 | 50 hours |
| 3.6% | 36 | 20 hours |
| 100% | 1,000 | 43 minutes |
Error budget consumption
Before writing any alerts, let’s think about error budget consumption.
One way to think about detection time is in terms of how much error budget gets used up before an alert fires. We can calculate this using the burn rate:
error_budget_consumed = burn_rate * alert_window / slo_window
The higher the burn rate and the wider the alert window, the more error budget consumed before the alert fires.
Consider our example alert from earlier, which had a 0.2% error rate threshold. It would fire when only 0.023% of the error budget was consumed. This is very sensitive! Arguably too sensitive.
alert_window = 5 minutes
slo_window = 30 days = 720 hours = 720 * 60 minutes

burn_rate = 2

error_budget_consumed = (2 * 5) / (720 * 60) = 0.023%
I like to think of this error budget consumption number as the area of the boxes in the diagram below.
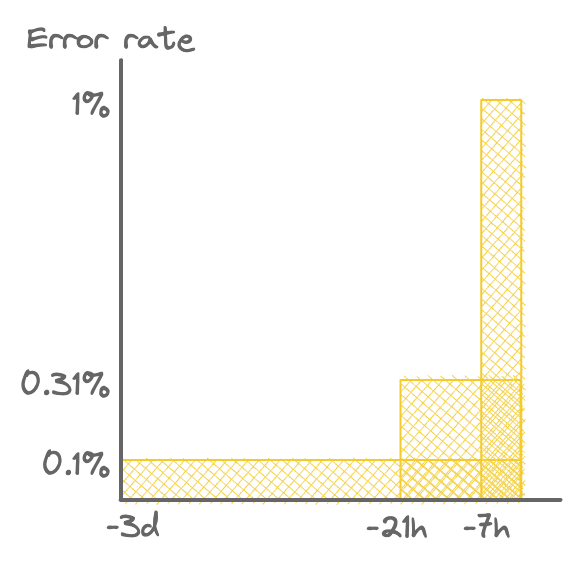
Detection thresholds for three alerts with 10% error budget consumption. Each has the same area.
This is also a good measure of significance. Events are significant when they consume a large proportion of the error budget. This can be because of either a high error rate or a long duration.
Detection time
Alerting after using 0.023% of our error budget is going to generate too many noisy alerts for non-significant events. Instead of designing alerts based on error rates, we could start from error budget consumption, and only alert after a significant amount of budget has been consumed. For example, we could alert after using 10% of our budget. For a burn rate of 1, it takes 3 days to consume 10% of the budget.
What happens to detection time for different error rates if we use a 3 day alert window?
| Error rate | Burn rate | Detection time | Time left to exhaustion |
|---|---|---|---|
| 0.1% | 1 | 3 days | 27 days |
| 0.6% | 6 | 12 hours | 4.5 days |
| 1.44% | 14.4 | 5 hours | ~2.75 days |
| 100% | 1000 | ~4 minutes | <40 minutes |
By looking at how long it takes to exhaust the error budget, we see that we can justify a much longer detection time, which gives us better precision. So our alerting rule now becomes:
- Burn rate: 1
- Alert window: 3 days
Urgency
If it takes a really long time to exhaust the error budget, do we even need to send page someone and potentially wake them up? In this case, perhaps we could just send a notification for someone to investigate during working hours.
To do this, we can create multiple windows. A short window for high burn rates and a long window for low burn rates. For the low burn rates, we might not need to page someone urgently, but instead send a notification to investigate later.
If the problem starts on a Friday night, we need to make sure we enough time to respond when someone checks the notifications on Monday morning. So let’s try taking 5 days as our dividing line, which gives us a burn rate of 6. If time to exhaustion is less than 5 days, we can treat this more urgently.
We might want to be more conservative with our error budget at high burn rates. To work out what alert windows to configure, we can rearrange the equation above. If we want to alert after using 5% of the error budget, our alert window would need to be 6 hours (0.25 days).
alert_window = error_budget_consumed * slo_window / burn_rate

# E.g. burn rate = 6, budget consumption = 5%
alert_window = 0.05 * 30 / 6 = 0.25 # days
Remember, shrinking the alert window reduces precision. But increasing the error threshold (or burn rate in this case) increases precision, so these somewhat balance out.
Optionally, we can add another alert for even more urgent events after even less error budget, for a shorter detection time. We then end up with something like the table below.
| Burn rate | Error budget consumed | Alert window | Detection time* | Action |
|---|---|---|---|---|
| 14.4 | 2% | 1 hour | ~50 secs | Page |
| 6 | 5% | 6 hours | ~2 min | Page |
| 1 | 10% | 3 days | ~4 min | Notification |
* For a complete outage (100% error rate).
Reset time
This is looking good, but still has a problem with reset time. Taking the 14.4 burn rate as an example, it will alert on a complete outage in less than a minute, and after the error rate goes back down to 0% it will take a full 59 minutes for the alert to stop firing.
The diagram below shows why. Any large enough spike of errors within the 1 hour window will trigger the alert, even if it has already stopped.
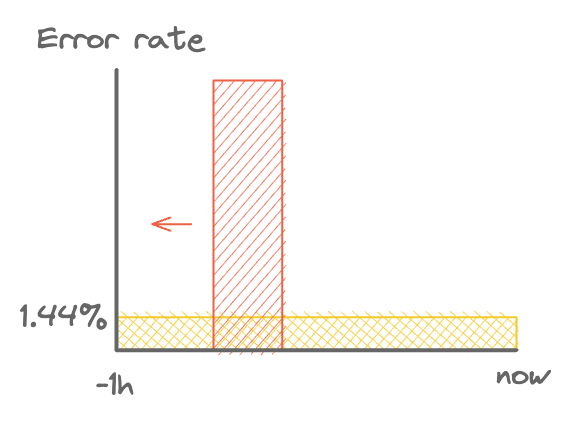
An alert uselessly firing after the errors have stopped.
We can counter this by combining two windows, our existing window and a shorter window. Taking our 1 hour window as an example, we could fire an alert only if both windows detect a high enough error rate. As the high error rate period to the left, the short window will stop firing and the alert will reset.
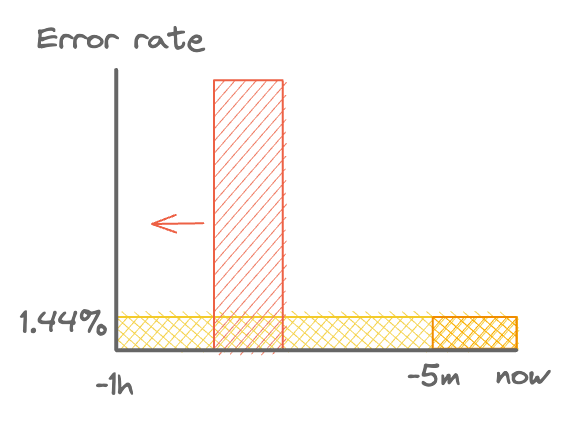
Using a short window to select only current errors. Short window shown in orange.
With that in mind, we can adjust our alerting rules like so:
| Burn rate | Error budget consumed | Long window | Short window |
|---|---|---|---|
| 14.4 | 2% | 1 hour | 5 mins |
| 6 | 5% | 6 hours | 30 mins |
| 1 | 10% | 3 days | 6 hours |
Final design
Now we have all we need to design our new alerting rules! What we end up with is something like this:
| Error threshold | Long window | Short window | Action |
|---|---|---|---|
| 1.44% | 1 hour | 5 mins | Page |
| 0.6% | 6 hours | 30 mins | Page |
| 0.1% | 3 days | 6 hours | Notification |
Note that if you’re using a different SLO over the same window, e.g. 99.95% or 99.99% over 30 days, then you can simply adjust the error thresholds and everything should still work. E.g. for 99.95% availability, simply halve them.
Visually, it looks like this:
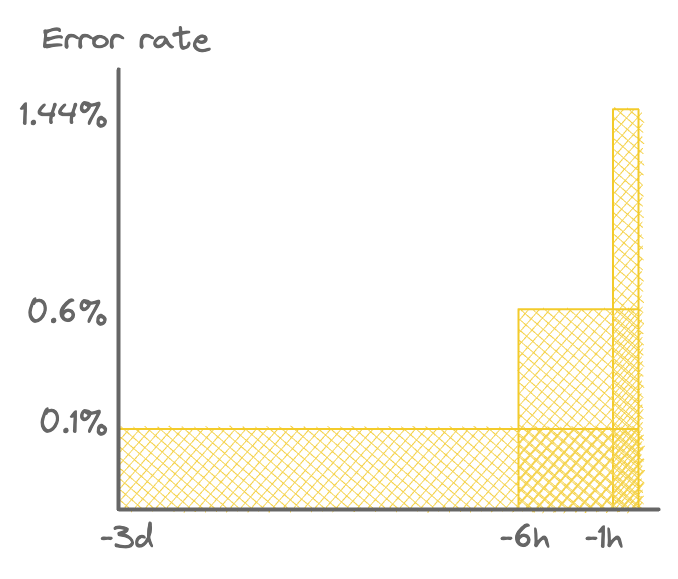
Multiple alert detection zones (not to scale).
The advantages of this system:
- Any event which could result in failing the SLO will be alerted on.
- Events need to be quite significant to generate an alert. At least 2% of the error budget must be used for any alert to fire. Low error rates need to consume at least 10% of the error budget.
- Only urgent alerts will result in an on-call engineer being paged.
- The alerts will reset quickly after the event has ended.
Writing the alerting rules
Now we (finally!) know what we’re aiming for, we can take a look at writing these alerting rules.
Let’s start with our burn rate = 1 alert, with just a single window for now.
- Burn rate: 1
- Alert window: 3 days
alert: MyServiceAvailabilityLowUrgency
expr: >
  (
    sum(rate(requests_total{service="my-service", error="true"}[3d]))
    /
    sum(rate(requests_total{service="my-service"}[3d]))
  )
  > 0.001
This is gonna be slow. Looking back over 3 days can be a lot of data.
You might think: “rate just does (last_sample - first_sample) / time_range, what’s the problem?”. Conceptually, yes, but with two important caveats:
- It needs to aggregate (
sum(...)) over an arbitrary number of time series. - It needs to look back over the entire time period to adjust for counter resets in (e.g. when your service restarts). This turns the calculation from constant to linear. Not good!
If your Prometheus instance is configured to use a 10s scrape interval, that’s 6 * 60 * 24 * 3 = 25,920 samples per time series to scan.
Luckily, there’s another way!
## Hourly averages

### Average rate of requests (within SLI) per service
- record: service:requests_total:rate1h
  expr: sum by (service)(rate(requests_total[1h]))

### Average rate of errored requests per service
- record: service:requests_errors_total:rate1h
  expr: sum by (service)(rate(requests_total{error="true"}[1h]))

### Average error rate ratio (errors / total) per service
### Range: 0-1

### 1 hour
- record: service:requests_error_ratio:rate1h
  expr: >
    # When we have data (>0 requests)
    (
      service:requests_errors_total:rate1h
      /
      (service:requests_total:rate1h > 0)
    )
    # When we don't have data (default to 0% error rate)
    OR (service:requests_total:rate1h * 0)

### 3 days
- record: service:requests_error_ratio:rate3d
  expr: >
    # When we have data (>0 requests)
    (
      sum_over_time(service:requests_errors_total:rate1h[3d:1h])
      /
      sum_over_time(service:requests_errors_total:rate1h[3d:1h]) > 0
    )
    # When we don't have data (default to 0% error rate)
    OR (sum_over_time(service:requests_errors_total:rate1h[3d:1h]) * 0)
Here we have some recording rules to pre-calculate hourly error ratios. These are quick to calculate using recording rules: Prometheus only needs to look back over the previous hour.
Then we use a neat trick: sum_over_time(some_metric:rate1h[3d:1h]). This takes 1 sample per hour, and calculates the sum over the last 3 days. Prometheus only needs to add up 24 * 3 = 72 samples per time series. One downside, which isn’t currently documented, is that this will only be calculated once per hour, on the hour. If you want better time resolution, you’ll need e.g. some_metric:rate5m[3d:5m] instead.
We can then write our alert like so:
alert: MyServiceAvailabilityLowUrgency
expr: service:requests_error_ratio:rate3d{service="my-service"} > 0.001
And for improved reset time:
alert: MyServiceAvailabilityLowUrgency
expr: >
  service:requests_error_ratio:rate3d{service="my-service"} > 0.001
  and
  service:requests_error_ratio:rate6h{service="my-service"} > 0.001
We can create similar recording rules for the other alerting rules. As long as the alert windows are consistent, these can be used to create alerts for different error threshold for different services.
Caveats
Now, nothing is ever perfect, and this system is no exception. Here are some caveats of this approach:
- Low traffic services – The lower the request rate, the more significant each request is to the overall error rate. In very low traffic services (or services with low request volumes overnight), a small number of errors can cause high error rates. This might not be a significant event, but could alert anyway. For more information, see Google’s SRE workbook.
- Very high or low availability SLOs – Below a certain expected level of availability, the combinations of error threshold and alert window suggested in this post will never fire. Very high expected levels of availability can burn through error budgets before alerts can reasonably expected to respond. Again, see Google’s SRE workbook for more information.
- Multiple QoS levels – For internal services, some requests might be required to complete a customer requests, while others might be for a less important background job. It is possible to classify requests and have different SLOs for different classes.
- Single customer outages – Some systems will serve many high-value customers, each with their own SLA. A single customer might only account for a small percentage of total traffic. A 100% error rate for one client might not trigger an alert, but still cause an SLA breach.
- Consumed error budgets – If you have already used up much of your budget for the current SLO period, your alerts might not be sensitive enough. These alerts might not trigger even if you’re consistently consuming 90% of your budget every month. In this case, effectively you only have 10% of your budget for unexpected events. Consider warning on burn rates < 1 to catch these situations.
Conclusions
The TL;DR of this post:
- To improve precision (make alerts less noisy), we can widen the alert window or increase the error threshold.
- To improve sensitivity (make sure we catch all significant errors), we can reduce our error threshold. Setting it to match our SLO rate gives us 100% sensitivity.
- To choose acceptable detection times we can look at burn rates and error budgets. By considering how long it takes to exhaust our error budget, and how much budget we’re willing to use, we can pick an appropriate alert window.
- To reduce reset times we can use multiple windows, and only alert when both the long and short window are detecting errors.
-
We can make use of multiple alerting rules with different actions for different levels of urgency. For non-urgent events, we can notify instead of paging. This can help make life less stressful for on-call engineers. In general:
Urgency Precision Sensitivity Detection time Action High Higher Lower Shorter Page Low Lower Higher Longer Notify
As ever, designing systems requires making trade-offs, and we’ve made several here. For one thing, we’ve replaced a simple system with a more complex one. Whether that is a good trade-off for your context is for you to decide.
Good luck! I wish you alerts that are less noisy than mine were before I started writing this post.